Australian CRO Statistics and Industry Benchmarks: 2024 Data
Marketing fails when it chases vanity traffic instead of revenue. As the founder of 3P Digital, I see Australian businesses fall into the same trap every day. They obsess over climbing search rankings and hitting arbitrary click targets, while their actual conversion metrics stagnate. Agencies sell them reports filled with impressions and clicks, but activity reports do not pay the bills. If your website traffic is not pointed at buyers, it is just draining your budget.
Benchmarking your performance is only useful if you measure it against actual revenue, not industry vanity metrics. Understanding standard conversion rate optimisation benchmarks for the Australian market gives you a realistic baseline, but it is merely the starting line. Too many marketing managers settle for average benchmarks because their agency told them a 1% conversion rate is normal. Normal keeps your business stagnant.
This article breaks down realistic conversion rate optimisation benchmarks across key Australian industries like mortgage broking, recruitment, and professional services. More importantly, we will look at where SMEs lose the most qualified leads in their funnels, and how applying our proprietary Profile, Plan, Perform framework uncovers the hidden revenue gaps in your business. We deal with real businesses, real numbers, real revenue.
Key Takeaways
Conversion rate optimisation must be treated as a primary revenue driver, not a tactical afterthought.
Industry averages for Australian conversion rates vary wildly by sector and intent, making generic benchmarks a poor performance target.
The highest drop-off points in Australian sales funnels occur at the form and initial landing page engagement stages.
The 3P Digital framework, Profile, Plan, Perform, uncovers market gaps and positions your offer to actual buyers.
Agencies should operate month to month with no lock-in contracts, proving accountability through live revenue dashboards.
Summary of Conversion Rate Optimisation Benchmarks
Factor | Typical Industry Focus | Primary CRO Challenge | Strategic Shift Required |
Mortgage Broking | Lead generation via contact forms | High friction form fields | Progressive profiling and trust signals |
Tech Recruitment | B2B placement enquiries | Long sales cycles and low intent | Niche positioning and CRM automation |
Professional Services | Consultation bookings | Unqualified prospect flow | Value-led content prior to enquiry |
B2B Construction/Trades | High-value project quotes | Price shopping and low conversion | Repositioning to target specific buyer avatars |
The Vanity Traffic Trap in Australian Marketing
Most digital marketing reports are designed to make the agency look good. They highlight traffic increases, keyword visibility, and ad impressions. I call this the vanity traffic trap. When you look under the hood of these reports, you often find a different reality. Traffic goes up, but lead quality goes down. Cost per acquisition spikes, but the agency blames external market factors.
In the Australian market, particularly within the SME and mid-market sectors, marketing managers face immense pressure to justify their ad spend. The ACCC has been highly active in cracking down on misleading advertising and unfair business practices across Australia, which means transparency is not just a moral choice, it is a regulatory requirement. However, true transparency means tracking the entire customer journey, not just the first click.
Consider the typical behaviour of a digital agency selling cookie-cutter packages. They promise a specific volume of traffic based on broad search volume data. They do not factor in the commercial intent of those users, nor do they map the traffic to your actual sales process. This approach ignores the advantage hiding in plain sight within your business. Your unique value proposition, your specific service delivery, and your ideal customer profile must dictate your marketing strategy.
The fundamental difference between good and bad marketing lies in accountability. Every dollar of spend must be pointed at buyers, not vanity traffic. When we audit a new client at 3P Digital, the first thing we look for is the disconnect between their traffic sources and their actual revenue. If your website attracts thousands of visitors but generates only a handful of low-quality leads, your conversion rate optimisation strategy has failed. You need data reported against revenue, not just clicks.
Challenging the Long-Term Contract Norm
There is a consensus in the agency world that clients must be locked into 12 to 24 month contracts to recoup setup costs and guarantee account management resources. I completely disagree. Agencies should operate month to month with no lock-in contracts.
Lock-in contracts encourage complacency. When an agency knows they have you locked up for two years, their incentive to innovate and drive results diminishes. They rely on sending activity reports rather than driving actual business results. If an agency is truly performance-focused, their reporting should be tied directly to live revenue dashboards. If they fail to perform, they should lose the client. At 3P Digital, our proprietary 3P Framework ensures we deliver value from month one, which is why we operate on monthly accountability, not legal lock-ins.
General Australian CRO Benchmarks Across Key Industries
Analysing Australian marketing statistics reveals a distinct pattern. Conversion rates vary drastically depending on the industry, the price point of the offer, and the intent of the user. While global studies often cite a standard 2.35% average conversion rate across e-commerce, Australian B2B and service-based businesses operate on entirely different metrics. E-commerce data frequently skews perception because impulse purchases and low-ticket items convert differently than high-value professional services or mortgage applications.
In the Australian mortgage broking sector, average conversion rates for organic search traffic often hover around the 2% to 4% mark. This sounds low compared to retail e-commerce, but a mortgage lead is worth significantly more over its lifetime. However, achieving a 4% conversion rate requires meticulous optimisation. We implemented a targeted SEO strategy for a Queensland mortgage broking client, achieving a 312% average organic traffic increase over six months. The traffic increase alone was meaningless until we aligned the landing pages with specific borrower intent, ensuring the new traffic actually converted into loan applications.
In recruitment, particularly tech recruitment, the sales cycles are notoriously long. A Sydney tech recruitment agency I worked with was competing against over 200 generic recruiters on price, with placement fees around $15,000 and sales cycles stretching out to six months. Their web conversion rate for new client enquiries was under 0.5%. The problem was not their website design. The problem was their positioning. They were attracting generic HR browsers instead of decision-makers.
Professional services face a similar hurdle. Law firms, accounting practices, and consulting firms often measure success by consultation bookings. If your landing page offers a generic contact form, you will attract unqualified tyre-kickers. Real conversion rate optimisation in these sectors involves qualifying the user before they even reach the form. It requires moving away from a broad approach and finding the advantage your competitors missed.
Why Averages Are a Dangerous Target
Relying strictly on industry averages is a trap. If the average conversion rate in your sector is 1.2%, hitting 1.5% might feel like a win. But if the top performing businesses in your sector are converting at 4% or 5%, settling for average means you are leaving massive revenue on the table.
Consider a real-world example from our own book of business. We took over the digital marketing for a national recruitment and building client. Their previous agency had them spending heavily on Google Ads with a cost per lead of $247 and a meagre 1.2% conversion rate. The previous agency told them this was the industry average for their sector. We knew it was a result of poor targeting and weak messaging. By restructuring the campaigns and focusing purely on qualified buyers, we achieved a 63.5% decrease in Google Ads spend while simultaneously increasing lead volume. We did not settle for the average benchmark. We changed the parameters of the campaign entirely.
Form and Funnel Drop-offs: Where SMEs Lose Leads
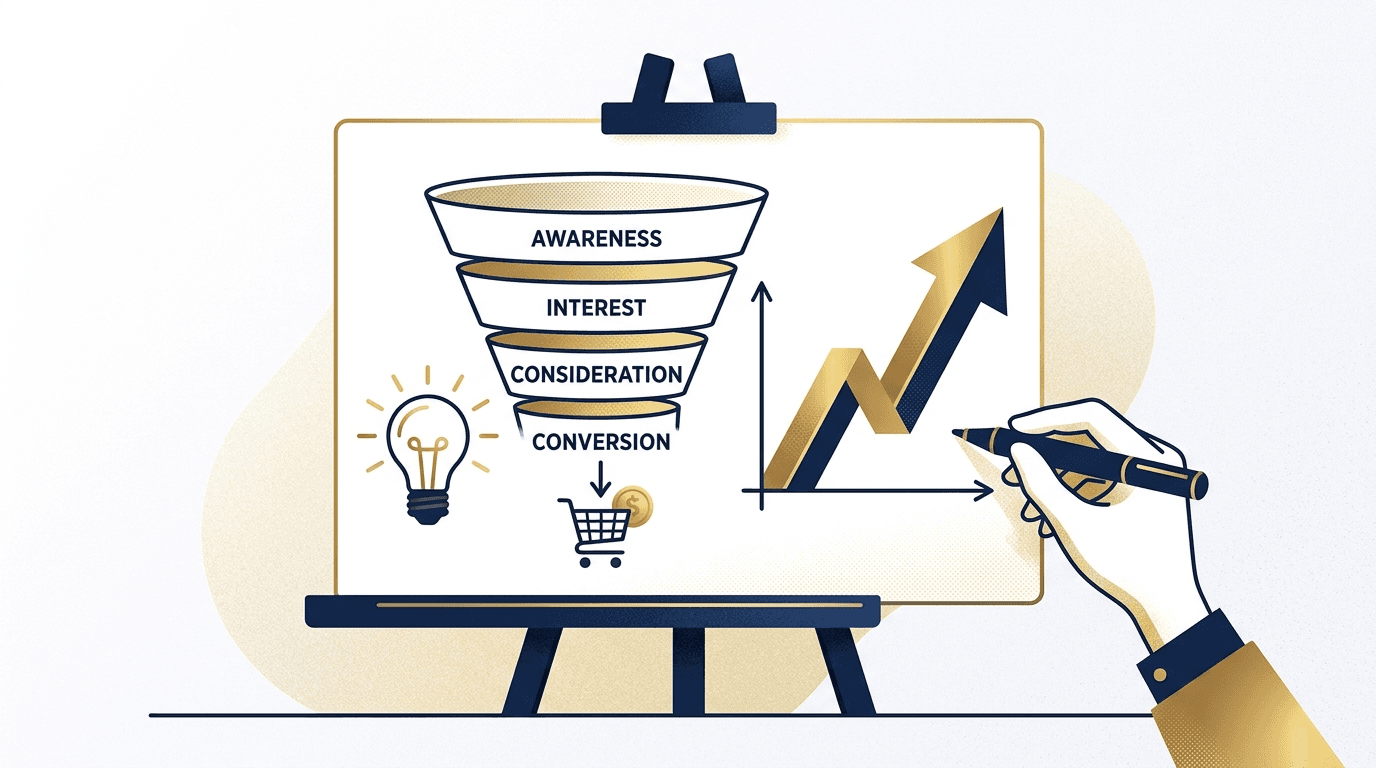
Understanding average conversion rates Australia wide only tells half the story. To truly optimise performance, you must analyse exactly where users drop off in your sales funnel. Australian SMEs consistently lose the majority of their qualified leads at two specific points: initial page engagement and form friction.
When we analyse user behaviour data through tools like Google Analytics 4 (GA4) and Hotjar, the drop-off patterns become glaringly obvious. Users click an ad or an organic search result, land on the page, and leave within five seconds. This is an intent and alignment failure. The ad copy promised one thing, or the search intent was misinterpreted, and the landing page failed to validate their decision to click. This high bounce rate distorts your overall conversion rate, dragging down your average and making your traffic acquisition look ineffective.
The second major drop-off occurs at the lead capture stage. Form friction is the silent killer of B2B conversions. Australian service businesses routinely ask users to fill out eight to ten field forms just to get a phone call. Every additional field in a form decreases the conversion rate. Users abandon forms that ask for excessive personal information too early in the relationship.
To fix form drop-offs, you have to align the information you request with the stage of the buyer journey. A first-time visitor should not be subjected to a qualification form that looks like a home loan application. You need progressive profiling. Ask for a name and email initially. Capture the rest of the data through CRM automation and subsequent interactions.
When we apply the 3P Digital methodology, we map every single touchpoint in the funnel. We identify the exact step where the user hesitates. By implementing targeted landing pages, streamlining forms, and adding strategic trust signals, we plug the leaks in the funnel. We ensure that the traffic reaching the form is highly qualified and ready to convert.
The 3P Digital Methodology Difference: Profile, Plan, Perform
You cannot fix a conversion problem just by changing the colour of a button. High bounce rates and low conversion rates are usually symptoms of a much deeper strategic issue. This is why standard CRO tactics fail. Agencies will run A/B tests on headlines and images, but they ignore the core messaging and market positioning.
Our entire worldview centres on the 3P Framework: Profile, Plan, Perform. This framework ensures that every optimisation effort is backed by deep market research and tailored strategy.
Phase 1: Profile
Before we touch a single line of code or write a single line of ad copy, we Profile. We map the market to find your edge. This involves identifying your Ideal Customer Profile (ICP), analysing competitor weaknesses, and finding the market gap your competitors missed.
In the Profile phase, we look for the advantage hiding in plain sight. We interview your best clients. We look for the specific pain points that your competitors are ignoring. If you try to market to everyone, you market to no one. Profiling is about building a comprehensive understanding of exactly who your highest-value buyers are, what they care about, and how they make purchasing decisions.
Phase 2: Plan
Once we know exactly who we are targeting, we build the Plan. We construct messaging and offers targeting actual buyers. This is not about generating generic brand awareness. This is about creating a direct path from traffic source to closed deal.
The planning phase involves developing a Go-To-Market (GTM) strategy. We map out the blue ocean strategy that allows you to operate without competing on price. We plan the SEO strategy, the paid media structure, the CRM automation, and the landing page architecture. Everything is designed to work together, guiding qualified traffic through a frictionless funnel. We ensure every element is pointed at buyers, not vanity traffic.
Phase 3: Perform
The final phase is Perform. This is where we execute across SEO, paid media, social media, content marketing, and CRM. Performance means driving measurable outcomes like shorter sales cycles, higher ROI, and increased revenue.
In the Perform phase, transparency is absolute. We do not hide behind vanity metrics. Every campaign, every keyword, and every landing page is reported against revenue. We build live dashboards that show our clients exactly how their marketing spend is translating into pipeline growth and closed deals.
Case Studies: Deep Discovery Over Cookie-Cutter Packages
To understand the impact of the Profile, Plan, Perform framework, you have to look at how deep discovery outperforms generic agency tactics. Here are real examples from our book of business showing what happens when you stop accepting average benchmarks and start demanding actual revenue growth.
B2B Construction: Repositioning for Higher Intent
I took over the digital marketing for a B2B construction company that was struggling with lead quality. They were spending $8,000 monthly on Google Ads. Their cost per lead was a staggering $247, and their landing page conversion rate sat at a dismal 1.2%. They were attracting price shoppers who had no intention of buying their high-value services.
We did not just rewrite their ad copy. We went back to the Profile phase. We interviewed their most profitable clients to find a niche gap. We discovered that their most profitable work came from first-time renovators who needed specific guidance, rather than general commercial builders looking for bulk pricing.
We repositioned their ads and landing pages specifically for first-time renovators. We added CRM automation to nurture these leads with educational content before pushing them to book a call.
The outcome was drastic. We reduced their cost per lead by 63% down to $91. Their landing page conversion rate jumped by 292% up to 4.7%. Most importantly, we shrank their sales cycle from 47 days down to 21 days. By finding the specific buyer avatar, we maximised their ROI and eliminated the price shoppers.
Tech Recruitment: Finding the Blue Ocean
Consider the Sydney tech recruitment agency I mentioned earlier. They were competing against 200-plus generic recruiters. Their sales cycles dragged on for six months, and they were averaging $15,000 placement fees. They wanted more traffic to their website. We told them more traffic was a waste of money until they fixed their positioning.
Through our deep discovery process, we identified a blue ocean opportunity in tech scale-ups. Instead of competing with every recruiter for generic IT roles, we repositioned the entire agency. We built a strategy targeting founders and HR leaders in rapidly scaling tech companies who needed highly specific talent to sustain their growth.
We launched targeted LinkedIn outreach and SEO content specifically for this niche audience. We did not just drive more traffic, we drove the right traffic.
The results transformed their business. They increased their average placement fee by 87% to $28,000. Their sales cycle dropped to 2 months. By leveraging their niche positioning, they generated $2,000,000 in new revenue in just 8 months. This is the power of deep discovery over cookie-cutter packages.
National Automotive Parts: Shifting to B2B Trade
A national automotive parts supplier was plateauing. They were losing market share to aggressive online competitors. They were over-relying on low-converting retail DIY customers who were highly price-sensitive. Their SEO and paid media were focused on broad, high-volume retail keywords.
We identified that their actual profit centre was the B2B trade market. Mechanics and auto repair shops were their best clients because they ordered repeatedly and were less sensitive to retail price fluctuations.
We shifted their entire digital marketing focus from retail DIYers to the B2B trade market. We built a dual-brand strategy to separate the retail and trade messaging. We created trade-focused content and built landing pages designed specifically to capture high-intent mechanics.
By pointing their marketing at actual buyers, we achieved a 46:1 ROI on their SEO investment over 12 months. We generated $2,300,000 in new B2B revenue. We grew their qualified trade leads by 127%. This proves that finding the advantage your competitors missed yields significantly higher returns than fighting over the same retail traffic.
Stop Settling for Average Benchmarks
If you are an Australian marketing manager or business owner, stop settling for average conversion rates. Activity reports do not pay the bills. If your agency is justifying mediocre results by pointing to industry averages, you need a new strategy.
Your business has a unique advantage. You have highly profitable clients that value your specific service. Your marketing needs to find more of those exact clients. That requires moving beyond standard traffic generation and implementing a rigorous conversion rate optimisation strategy backed by deep market profiling.
At 3P Digital, we do not do cookie-cutter packages. We operate on monthly accountability with no lock-in contracts, proving our value through live revenue dashboards. If you want to stop chasing vanity traffic and start driving measurable revenue growth, it is time to act. Book a tailored CRO audit or consultation with our team today. We will help you find the advantage your competitors missed and turn your digital marketing into a predictable revenue engine.
Frequently Asked Questions (FAQs)
What is a good conversion rate for Australian B2B businesses?
A good conversion rate depends heavily on the industry, the ticket price, and the traffic source. While global e-commerce averages hover around 2.35%, Australian B2B and professional services typically see conversion rates between 2% and 5% when targeting high-intent buyers. Rather than aiming for a generic average, you should focus on maximising the quality and ROI of the leads you do convert.
How do you calculate conversion rate optimisation ROI?
To calculate CRO ROI, you need to track the revenue generated from the leads converted through your optimised funnels. Subtract the cost of the CRO work and the traffic acquisition from the total revenue generated. A true performance-focused agency will report this data directly against your revenue dashboards, proving the financial return of the optimisation efforts.
Why do marketing agencies use lock-in contracts?
Many agencies use lock-in contracts to secure recurring revenue and recoup initial setup costs. However, these contracts often lead to complacency. A performance-focused agency should operate month to month, proving their value continuously through live revenue dashboards and tangible business results, not just activity reports.
What is the Profile, Plan, Perform framework?
The Profile, Plan, Perform framework is the 3P Digital methodology. Profile involves mapping the market and identifying your ideal customer. Plan involves building tailored messaging and strategy targeting those buyers. Perform involves executing the strategy across digital channels and reporting strictly against revenue. It ensures every campaign is pointed at buyers, not vanity traffic.
How long does it take to see results from CRO?
Initial results from CRO, such as reduced cost per lead and improved form completion rates, can often be seen within the first month of implementing technical fixes. However, strategic changes involving market repositioning and CRM automation typically take three to six months to reflect in significant revenue growth.
What are the most common causes of low conversion rates?
The most common causes of low conversion rates include poor traffic intent, misaligned messaging, high form friction, and a lack of trust signals on landing pages. Often, a low conversion rate is a symptom of a deeper strategic issue, such as targeting the wrong audience or competing purely on price.
References
Australian Competition and Consumer Commission (ACCC) - Misleading or deceptive conduct guidelines and business regulations.
Google Analytics 4 (GA4) platform documentation for user behaviour and funnel tracking metrics.
WordStream - Historical benchmarks for average conversion rates across search and display advertising networks.
Australian Bureau of Statistics (ABS) - Data on digital activity and business indicators for the Australian economy.