CRO Benchmarks: Moving Beyond Vanity Metrics to Real Revenue
Most digital marketing agencies sell vanity traffic and activity reports. They hand over glossy PDF dashboards showing spikes in organic sessions, low bounce rates, and high impression counts. For Australian business owners in mortgage broking, recruitment, fitness, and professional services, this data is practically useless. Marketing is completely ineffective unless it is reported against revenue and real business growth.
The Australian market is too competitive to settle for activity disguised as progress. When you search for Australian CRO statistics, you are often met with fragmented data or irrelevant clinical trial information that fails to help your lead generation business. You need clear conversion rate optimisation benchmarks tied directly to real business growth.
I am Alex Frew, founder of 3P Digital. We exist to completely change how Australian businesses think about marketing. Instead of chasing leads, our clients have qualified prospects come directly to them. This guide consolidates the actual numbers that matter, bypassing surface-level metrics to focus entirely on measurable marketing ROI. We will explore how to use hard data, specific positioning, and accountable execution to find the advantage hiding in plain sight.
Key Takeaways
Most marketing reporting focuses on vanity traffic rather than measurable marketing ROI.
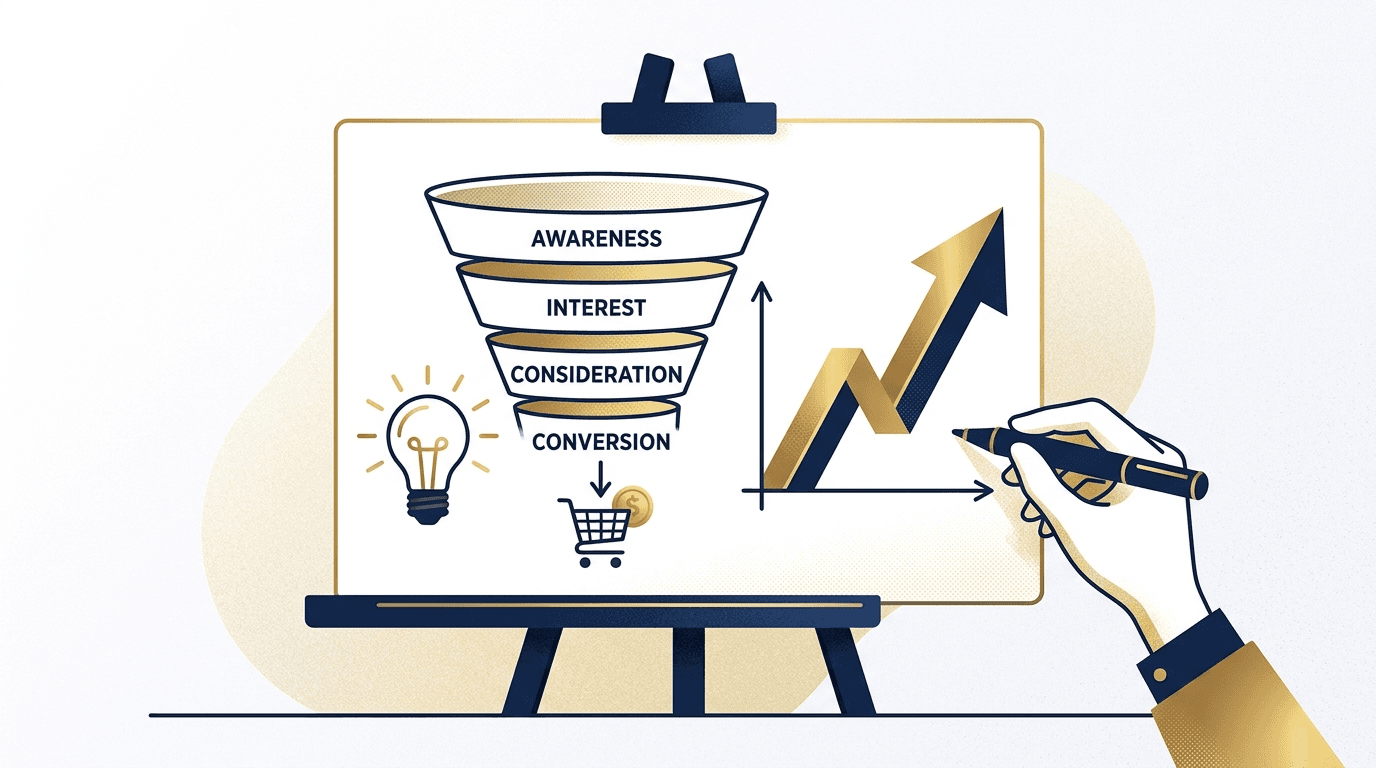
True conversion rate optimisation requires mapping the entire funnel from first click to final sale.
Casting a wide net forces you to compete on price. Narrowing your focus to a specific niche creates a blue ocean opportunity.
Agencies should operate month to month with no lock-in contracts, proving their value continuously.
The 3P Framework, which consists of Profile, Plan, and Perform, ensures every dollar targets actual buyers.
Summary Table: Vanity Metrics vs. Revenue Metrics
Concept | Vanity Traffic Focus | Measurable ROI Focus |
Primary Goal | Maximise sessions and clicks | Maximise qualified leads and sales |
Core Metric | Organic traffic volume | Cost per acquisition and conversion rate |
Reporting Style | Monthly activity reports | Live revenue dashboards |
Contract Model | Long-term lock-in contracts | Month-to-month accountable execution |
Positioning | Broad target market | Deep discovery into a specific niche |
The Problem with Vanity Metrics in Performance Marketing
Australian business owners are consistently sold a false narrative. They are told that more traffic equates to more revenue. This is a fundamental misunderstanding of performance marketing. Driving 10,000 new visitors to a poorly optimised website with weak positioning will yield zero new clients. Yet, agencies continue to sell search engine optimisation and paid media packages based purely on volume metrics.
Consider a typical scenario. A marketing manager at a professional services firm receives a monthly report showing a 20 percent increase in organic traffic and thousands of ad impressions. The report looks impressive. However, the sales team has not received a single new qualified lead. This disconnect happens because the agency is incentivised to show activity rather than business growth.
We see this failure constantly. MEC Builders, a construction and renovation business, came to us after spending $8,000 monthly on Google Ads with three previous agencies. Their cost per lead was an exorbitant $247, and their conversion rate was a dismal 1.2 percent. The previous agencies had driven traffic, but they attracted price shoppers. The traffic was entirely vanity. It was not driving revenue.
Why Activity Reports Fail Australian SMEs
Activity reports are designed to protect the agency, not the client. When an agency operates on a 12-month lock-in contract, their primary motivation is retention through perceived value. They want to show you that they are doing work. They highlight hours spent, links built, and keywords targeted. They do not highlight the cost per lead or the actual return on ad spend.
This model breeds complacency. Agencies become comfortable sending activity reports because there is no immediate consequence if the campaign fails to generate revenue. The difference between good and bad work in this industry comes down to accountability and positioning. If a strategy is genuinely working and generating revenue for the client, they will stay. You do not need a lock-in contract to force them to stay when your work is driving their business forward.
To achieve genuine measurable marketing ROI, we must discard the standard activity report. We manage our client engagements on live dashboards with no lock-in contracts. This model enforces accountability. If we do not perform, the client can leave. This pressure ensures we remain focused exclusively on metrics that impact the bottom line.
Consolidated CRO Benchmarks and Australian CRO Statistics
Conversion rate optimisation is the systematic process of increasing the percentage of website visitors who take a desired action. In the context of Australian CRO statistics, most generic benchmark reports are fundamentally flawed. They aggregate data across dozens of industries, mixing high-volume e-commerce stores with low-volume B2B professional services.
A 2 percent conversion rate might be a failure for an e-commerce brand but an exceptional benchmark for a commercial recruitment agency. When you analyse CRO benchmarks, you must filter for your specific industry, average order value, and sales cycle length. Generic data provides generic results.
When we evaluate a campaign, we do not look at isolated conversion rates. We look at the complete cost per acquisition and the lifetime value of the client. This is how we established our own internal benchmarks. Across our book of business, we have driven a 312 percent average traffic increase for targeted SEO engagements. However, traffic volume is never the primary key performance indicator. The primary indicator is lead quality and revenue generated.
Analysing Conversion Rate Optimisation Metrics
To properly analyse conversion rate optimisation, you must track micro-conversions and macro-conversions. Macro-conversions are completed purchases or signed contracts. Micro-conversions are actions that indicate high intent, such as downloading a whitepaper, completing a multi-step form, or watching a sales video.
Most Australian SMEs fail because they only track macro-conversions. They do not understand the friction points in their user journey. By implementing granular tracking, we can identify exactly where users drop off. For example, if you operate a fitness studio, a macro-conversion is a signed 12-month membership. A micro-conversion is booking a free trial class.
If your paid media campaigns drive hundreds of trial bookings but zero memberships, you do not have a traffic problem. You have a sales or offer problem. Understanding the difference between vanity traffic and engaged prospects requires a mature analytics setup. This is why we prioritise deep discovery during the analytics audit phase. We want to find the advantage hiding in plain sight within your existing data.
Benchmarks for Lead Generation Businesses
For lead generation businesses in mortgage broking, recruitment, and professional services, standard e-commerce metrics do not apply. You cannot measure success by adding items to a cart. Your conversion funnel is longer and involves human interaction.
The critical CRO benchmarks for these industries revolve around cost per lead, lead to customer rate, and sales cycle duration. A high conversion rate on a landing page means nothing if the leads are unqualified and fail to close.
When we restructured the Google Ads campaign for MEC Builders, we focused on these exact lead generation benchmarks. By changing the messaging to target first-time renovators who hate surprises, we fundamentally altered the quality of the traffic. We reduced their cost per lead by 63.5 percent, dropping it from $247 down to $91. Simultaneously, we increased their conversion rate by 292 percent. This did not happen by magic. It happened by applying strict CRO principles to the ad copy, the landing page, and the CRM automation that followed.
The 3P Framework Advantage: Profile, Plan, and Perform
True conversion rate optimisation begins before a single line of code is written or an ad campaign is launched. It starts with positioning. Most Australian businesses try to be everything to everyone. They cast a wide net, hoping to catch anyone who might be remotely interested in their services. This approach inevitably leads to competing on price.
To break free from price competition, you must deliberately narrow your focus. You need a framework that enforces accountable execution at every stage of the campaign. At 3P Digital, we use the 3P Framework: Profile, Plan, Perform. This framework ensures we uncover competitive advantages that your competitors missed.
Phase 1: Profile
The Profile phase involves exhaustive deep discovery. Before we build a strategy, we must understand your market, your competitors, and your ideal customer profile. We conduct deep discovery interviews with your most profitable clients. We want to know why they chose you, what alternatives they considered, and what specific language resonated with them.
During this phase, we map the market to find gaps. We are not interested in competing for generic search terms that are dominated by massive corporations with infinite budgets. We want to find the highly specific, high-intent queries that indicate a ready buyer.
Consider our work with a national tech recruitment agency. They were competing against 200-plus generic recruiters. They faced 6-month sales cycles and average placement fees of $15,000. They had no clear differentiation. Their website was generating traffic, but it was the wrong kind of traffic.
Through our discovery interviews, we identified a blue ocean opportunity. Instead of targeting all corporates, we repositioned the agency exclusively for tech scale-ups. We built a profile of the exact founders and hiring managers we needed to reach.
Phase 2: Plan
Once we have a defined profile, we build a comprehensive plan. Strategy is built around that exact advantage we uncovered during the discovery phase. The plan outlines the specific channels, messaging, and funnels we will use to reach the target audience.
For the tech recruitment agency, the plan involved moving away from generic job boards. We launched a Scale-Up Hiring Audit lead magnet designed specifically to appeal to Series A to C founders. We initiated targeted LinkedIn outreach to these specific founders. The messaging was highly tailored.
This phase also includes CRO planning. We design landing pages and conversion funnels that directly address the pain points identified in the Profile phase. Every element on the page, from the headline to the call to action, is engineered to guide the user toward a macro-conversion.
Phase 3: Perform
Execution follows, managed on live dashboards. The Perform phase is where measurable marketing ROI is realised. We launch the campaigns, monitor the data, and optimise relentlessly.
Because we operate with no lock-in contracts, the Perform phase is critical. If the campaign does not generate leads and revenue, the client will leave. This creates a powerful incentive for continuous optimisation. We do not set and forget. We actively manage the performance marketing efforts.
For the tech recruitment agency, our performance execution generated $2 million in new revenue. We increased their placement fees by 87 percent to $28,000. We reduced their sales cycle to just 2 months. By targeting a specific niche, we captured an estimated 15 percent market share in Sydney. These results were achieved not by increasing traffic, but by aligning the traffic with a compelling, highly targeted offer.
Real Outcomes from Strategic Narrowing Focus
The data from our own book of business proves that narrowing focus and relying on hard data reduces cost per lead while increasing overall revenue. Let us look at another example.
A Queensland mortgage broker was stuck on page 3 of search results and struggling to generate consistent inbound business. They had been told by previous consultants that they needed to target broad terms like home loans and mortgage broker. These terms are hyper-competitive and dominated by major banks.
We implemented a targeted SEO campaign focused on high-intent industry keywords and local search dominance. By shifting the focus from generic terms to specific, localised search queries, we found an audience that was ready to act.
The outcome was substantial. We generated 40-plus qualified leads per month from organic search alone. This targeted approach drove a 312 percent increase in organic traffic within 6 months. More importantly, it generated a 46 to 1 return on investment on a separate 12-month B2B automotive and parts supplier campaign.
Our 98 percent client retention rate across 250-plus Australian businesses served over 10-plus years is built on these types of results. We do not retain clients by holding them to a contract. We retain them by continuously driving down their cost per acquisition and increasing their lifetime value.
Frequently Asked Questions
What are Australian CRO statistics?
Australian CRO statistics track conversion rate optimisation metrics specific to the Australian market. However, generic statistics are often misleading. True CRO benchmarks must be segmented by industry, average order value, and target audience. Instead of relying on broad averages, you should track your internal cost per lead, conversion rate, and sales cycle duration against your historical data.
Why are vanity metrics dangerous for Australian businesses?
Vanity metrics, such as raw page views and social media likes, are dangerous because they create a false sense of success. They make a campaign look active on paper without contributing to measurable marketing ROI. When businesses focus on vanity traffic, they waste capital on audiences that have no intention of buying, which drives up the true cost per acquisition.
How does the 3P Framework improve conversion rates?
The 3P Framework improves conversion rates by ensuring absolute alignment between your offer, your target audience, and your execution. The Profile phase identifies the exact buyer, the Plan phase builds a strategy tailored to that buyer, and the Perform phase optimises the campaign using live data. This systematic approach eliminates wasted ad spend on unqualified traffic.
Does 3P Digital require long-term lock-in contracts?
No. We believe agencies should operate month to month with no lock-in contracts. If a strategy is genuinely working and generating revenue for the client, they will stay. Lock-in contracts often incentivise complacency and activity reports rather than actual business growth. We prove our value continuously through live dashboards.
What is a good cost per lead for a professional services firm?
A good cost per lead depends entirely on your lifetime customer value and profit margins. A $250 cost per lead is too high for a low-margin e-commerce store, but it is highly profitable for a recruitment agency with a $15,000 placement fee. The goal of conversion rate optimisation is not to achieve an arbitrary industry average, but to continuously lower your cost per lead while increasing lead quality, as demonstrated by our 63.5 percent decrease in cost per lead for MEC Builders.
How long does it take to see results from a CRO campaign?
Results from a CRO campaign can be immediate if the existing traffic is high and the conversion friction is obvious. However, for sustainable performance marketing results, you should allow 3 to 6 months for proper data collection, deep discovery, and strategy implementation. We achieved a 312 percent increase in organic traffic for a mortgage broker within a 6-month engagement.
References
Australian Competition and Consumer Commission (ACCC): Scamwatch and digital marketing guidelines regarding misleading advertising metrics and consumer guarantees in Australia. (https://www.accc.gov.au)
Australian Bureau of Statistics (ABS): Data on digital activity and business indicators for Australian SMEs. (https://www.abs.gov.au)