A Strategic Heatmap and Session Recording Methodology for Australian SMEs
Most digital marketing agencies sell activity reports instead of revenue. They celebrate when your website traffic spikes, showing you colourful graphs that supposedly represent success. The problem is that traffic is just vanity metrics if it attracts price shoppers instead of serious buyers. As the founder of 3P Digital, I have sat in hundreds of boardrooms across Australia looking at those exact graphs. I always ask the same question: how much revenue did that traffic actually generate? Usually, the room goes quiet.
Australian business owners and marketing managers are consistently frustrated by website visitors that bounce or attract people who only want to know the cheapest price. You can spend tens of thousands of dollars on Google Ads and search engine optimisation, but if your landing pages are fundamentally broken, that money flows straight down the drain. This is where a strict heatmap and session recording methodology comes in. This is not a superficial activity to watch people scroll. It is an essential diagnostic step to uncover why high traffic fails to convert into qualified leads.
At 3P Digital, we operate on a simple philosophy. We believe marketing must be accountable to the bottom line, starting with deep discovery to find the competitive advantage hiding in plain sight. We do not guess. We analyse actual buyer behaviour using our proprietary 3P Framework: Profile, Plan, Perform. In this guide, I am going to show you exactly how we use website user behaviour analysis to turn empty clicks into predictable, qualified lead generation. We believe agencies should operate month to month without lock in contracts because the performance should justify the fee, and everything we do is reported against revenue.
Key Takeaways
Vanity traffic is a liability: Driving thousands of clicks to an unoptimised page simply wastes your marketing budget.
Diagnostic precision matters: A rigorous heatmap and session recording methodology reveals the exact friction points causing users to bounce.
Focus on buyer intent: Repositioning your messaging to attract serious buyers rather than price shoppers shortens sales cycles and improves conversion rates.
Deep analysis beats assumptions: Implementing qualitative analysis tools allows you to see exactly how users interact with your value proposition.
Revenue over clicks: True performance marketing means every adjustment is measured against bottom line revenue, not empty metrics.
Summary Table: Vanity Traffic vs. Behaviour-Driven CRO
Feature | Vanity Traffic Approach | Behaviour-Driven Methodology |
Core Focus | Maximising total clicks and impressions | Analysing and improving the buyer journey |
Primary Tools | Basic SEO and broad match Google Ads | Heatmaps, session recordings, funnel analysis |
Target Audience | Generic searchers and price shoppers | Ideal Customer Profile (ICP) and qualified leads |
Measurement | Traffic volume and keyword rankings | Lead quality, cost per acquisition, revenue |
Risk Level | High (prone to algorithm updates and waste) | Low (focuses on proven conversion paths) |
Decoding the Methodology: Finding the Advantage Hiding in Plain Sight
When most marketing managers hear the term heatmap, they think of a simple visual overlay showing where people clicked. That is a superficial understanding. A strategic heatmap and session recording methodology goes much deeper. It is the process of combining qualitative visual data with quantitative metrics to understand exactly why users behave the way they do on your website. We use this process to find the advantage your competitors missed.
Most agencies and business owners make the mistake of relying solely on Google Analytics. While GA4 is excellent for telling you what happened on your site, such as how many people visited a page or where they dropped off, it completely fails to tell you why it happened. You might see that your service page has a 75 percent bounce rate, but the data does not show you that users are actually trying to click on an image that looks like a button but is not linked. That is the difference between quantitative and qualitative data.
Implementing Website User Behaviour Analysis
Effective website user behaviour analysis requires a strict operational framework. You cannot simply install a tracking script and hope insights will magically appear. We follow a meticulous process during the Profile and Plan stages of our 3P Framework.
First, we define the macro and micro conversions. A macro conversion might be submitting a contact form or requesting a quote. A micro conversion could be downloading a guide, scrolling to the pricing section, or spending more than three minutes on an informational page. Without clearly defining these events, your analysis will lack focus.
Second, we segment the audience. Not all website visitors are equal. We filter session recordings to isolate first-time visitors versus returning users, mobile versus desktop users, and high-intent traffic sources versus low-intent referral traffic. If you analyse all users as a single group, the data becomes muddy and effectively useless.
Understanding the Nuances of Click, Move, and Scroll Data
Heatmaps come in three primary variations, and understanding the limitations of each is critical for a successful conversion rate optimisation strategy.
Click maps: These show where users click their mouse. On desktop, this is straightforward. However, on mobile devices, a click map actually tracks touch events. We frequently find that mobile users aggressively tap images expecting them to expand or link to more information. When those images are static, the user experiences immediate frustration and leaves.
Move maps: These track mouse movement. There is a long-standing debate in the analytics community about the correlation between mouse movement and eye tracking. While they are not identical, mouse movement serves as a reliable proxy for visual attention on desktop devices. Users often rest their cursors on text they are actively reading. If your move map shows intense activity around your headlines but zero activity near your call to action, your copy is engaging but your value proposition is misaligned.
Scroll maps: These indicate how far down a page users travel before abandoning it. Scroll maps are incredibly revealing. I have reviewed countless landing pages where the most critical information, such as a trust signal or a unique mechanism, is placed below the fold. The scroll map shows a massive drop off before users ever reach that section.
The Role of Session Replays in Identifying Micro-Friction
Session replays bridge the gap between raw data and human empathy. Watching a session replay allows you to literally watch a user navigate your website. You see their cursor hesitate. You see them scroll up and down frantically looking for an answer. You see them fill out a form, delete it, and leave.
We use session replays specifically to identify micro-friction. Micro-friction is any small element of your user interface that causes cognitive load or frustration. This could be a form field that lacks clear labelling, a slow loading image, or a confusing navigation menu. In the Australian market, where consumers expect seamless digital experiences modelled after major retailers, micro-friction is a conversion killer.
From Data to Revenue: Building a Conversion Optimisation Strategy
Data collection without execution is just expensive voyeurism. The entire purpose of our heatmap and session recording methodology is to drive bottom line revenue. Once we have gathered sufficient visual data, we move into the conversion rate optimisation strategy phase.
This phase requires discipline. We prioritise changes based on potential revenue impact and ease of implementation. We do not waste time arguing over button colours. We focus on structural changes that align user intent with business objectives.
The Danger of Chasing Volume Over Intent
In today's competitive digital landscape, the knee-jerk reaction to poor conversion rates is usually to buy more traffic. Business owners think the solution to a leaky bucket is simply pouring more water into it. This is a fundamentally flawed approach.
I learned this firsthand with an automotive dealership group we worked with. They were plateauing, losing market share to online competitors, and over reliant on low value retail buyers. Their marketing team kept increasing their Google Ads spend to drive more foot traffic, but the leads were constantly demanding discounts.
We implemented our heatmap and session recording methodology on their primary landing pages. The data revealed something fascinating. The retail buyers were spending all their time clicking on promotional banners and ignoring the core service pages. Meanwhile, the small amount of B2B trade traffic that did arrive was trying to navigate a convoluted menu structure to find fleet pricing information.
By shifting focus to local SEO and high intent service page optimisation, specifically targeting the B2B trade market instead of retail, we changed the entire trajectory of the business. We removed the distracting promotional elements that attracted price shoppers and streamlined the navigation to fleet services. The result was a 46:1 return on SEO investment within 12 months and $2.3 million in new B2B revenue. That is the power of focusing on buyers, not vanity traffic.
Creating Hypotheses Based on Behavioural Evidence
When we identify a point of friction, we do not just blindly change it. We formulate a hypothesis grounded in evidence. For example, if a scroll map shows a 60 percent drop off at a specific section of a landing page, and session recordings confirm that users are actively scrolling away when they hit a dense block of text, our hypothesis might be: "Users are abandoning the page because the value proposition is obscured by too much copy. Breaking this text into bullet points and adding a visual asset will improve retention and push more users to the pricing section."
We then implement the change, monitor the subsequent session recordings, and measure the impact on lead volume. This rigorous feedback loop is how you turn visual user data into an actionable conversion optimisation strategy.
Identifying Friction: Where Serious Buyers Drop Off
Friction is the enemy of conversion. Every extra second a user spends trying to figure out what to do next is a second they might decide to hit the back button and go to a competitor. In Australia, industries like mortgage broking, recruitment, and professional services have long, considered sales cycles. The friction points are numerous.
Common Friction Points in the Australian Market
Through thousands of hours of reviewing session recordings for Australian SMEs, I have identified three recurring friction points that destroy conversion rates.
First, excessive form fields. Australian consumers are highly protective of their personal data. Requesting a mobile number, email address, physical address, and date of birth on an initial enquiry form is a recipe for disaster. Session recordings consistently show users filling out the first two fields, seeing the rest of the form, and abandoning the page. Limiting initial enquiries to name and email is often the fastest way to increase lead volume.
Second, ambiguous value propositions. Many businesses assume their audience understands exactly what they do. Heatmaps often show users clicking rapidly between the "About Us" and "Services" pages, indicating confusion. If your headline does not clearly articulate the specific problem you solve, users will leave. We see this constantly in the recruitment sector. Agencies use vague terms like "talent solutions" instead of clearly stating "IT recruitment for Sydney tech startups."
Third, hidden contact details. In professional services, trust is paramount. If a user has to dig through a drop down menu to find a phone number or a physical suburb location, trust evaporates. Move maps frequently show users scanning the top right corner of the header and the bottom of the footer for contact information.
Optimising the Sales Journey for Qualified Leads
To illustrate this, let me share a story about a national recruitment firm we worked with. They were overpaying for leads on expensive job boards and struggling with high acquisition costs. We implemented our methodology on their candidate and client portals.
The session recordings revealed a massive disconnect. Candidates were successfully finding job listings but could not easily apply without creating a complex profile. Clients, on the other hand, were dropping off the "Request a Consultation" page because the calendar booking system was broken on mobile devices.
We stripped back the candidate application process to a simple two-step form. For clients, we replaced the broken calendar with a direct lead capture form and a prominent "Call Us" button for mobile users. We also replaced expensive job board spend with an SEO and content strategy targeting both candidate and client search intent. By removing the technical friction and focusing on search intent, we generated 574 leads at a 63.5 percent lower cost per lead, creating a consistent and lower cost lead pipeline.
Case in Point: Shifting Perspectives from Clicks to Revenue
A Queensland mortgage broker came to us stuck on page 3 of search results and relying on inconsistent lead generation. They had been told by a previous agency that they just needed more traffic. They were spending $5,000 a month on ads and getting plenty of clicks, but their lead form was practically empty.
When we deployed our heatmap and session recording tools, the problem was immediately obvious. Their landing page was focused entirely on their own company history. The heatmaps showed users ignoring the "Our Story" section completely. Session recordings showed mobile users scrolling rapidly, looking for interest rates or a repayment calculator, and leaving when they could not find them.
This is a classic example of a misaligned landing page. The broker was talking about themselves, but the users only cared about their own problems. We restructured the page based on our Profile findings. We moved the company history to the footer. We placed a custom mortgage calculator above the fold. We added a clear, single call to action next to the calculator: "Get your tailored rate."
The behavioural shift was instantaneous. Subsequent session recordings showed users engaging heavily with the calculator. Because the calculator required them to input their email address to see the final tailored result, lead capture increased naturally without feeling forced.
By pairing this highly optimised landing page with a targeted SEO and high intent content strategy aimed at capturing their primary keyword market, we achieved position 1 rankings. The result was a 312 percent increase in organic traffic over 6 months. More importantly, that traffic was finally converting. They now generate 40+ qualified leads per month from organic search alone.
This is the essence of the 3P Framework. We Profile the user's actual behaviour. We Plan a strategic intervention based on that evidence. We Perform the technical execution. And we do it all without lock in contracts because the results speak for themselves. We maintain a 98 percent client retention rate because we do not sell activity. We are reported against revenue.
Implementing Your Own Behavioural Analytics Stack
To execute this methodology correctly, you need the right tools. CRO services Australia rely on robust analytics platforms. While many tools exist, the market leaders provide specific features that are critical for deep analysis.
Hotjar (by Contentsquare)
Hotjar is probably the most recognised tool in the market. It provides solid heatmapping (click, move, scroll) and session recording capabilities. It is highly accessible for marketing managers who are new to qualitative analytics. Its pricing model is based on daily session limits, which means you need to ensure your sample size is statistically significant before making major decisions. Hotjar is excellent for identifying broad trends and obvious user frustrations.
Microsoft Clarity
Microsoft Clarity has disrupted the market by offering a completely free tier with unlimited traffic. For Australian SMEs operating on tight budgets, Clarity is a phenomenal starting point. It offers session recordings and automated heatmaps. Its standout feature is "Insights", powered by machine learning, which automatically flags pages with high rage clicking or dead clicks. The limitation with free tools is data privacy filtering can be less sophisticated, so you must ensure you are masking sensitive form fields to comply with the Australian Privacy Act.
Mouseflow
Mouseflow is a heavy duty tool that we frequently use for complex B2B websites. It offers advanced funnel tracking, allowing you to build specific step-by-step journeys and watch recordings of users who drop off at exact points. Mouseflow also features robust form analytics, showing you exactly which field in a long application form causes the highest abandonment rate. For recruitment or finance websites with multi-page applications, this level of granularity is essential.
The Role of Google Analytics 4
While GA4 is not a behavioural visualisation tool, it is the necessary quantitative backbone. We use GA4 to identify the exact pages with high traffic but low conversion rates, or pages with abnormal drop off rates. We then feed those specific URLs into our heatmap tools. GA4 tells us where the problem is. Heatmaps and session recordings tell us what the problem is.
Behavioural Tracking in Specific Australian Industries
The application of this methodology shifts depending on your industry. The friction points in an e-commerce store are entirely different from those in a B2B professional services firm. At 3P Digital, we tailor our analysis to the specific realities of the Australian market.
Mortgage Broking and Finance
In the finance sector, trust and clarity are paramount. Users are looking for transparency regarding rates, fees, and borrowing power. We frequently see friction in the document upload process. Users apply for a loan, reach the secure document portal, and abandon the process because the interface is intimidating or requires them to create a new account rather than logging in via their bank. Heatmaps here reveal where users hesitate before clicking "submit" on sensitive financial data. Simplifying this journey is critical for conversion.
Recruitment Agencies
For recruitment, the dual audience of candidates and clients creates complexity. Candidates often apply via mobile devices on their lunch breaks. If your application form is not fully responsive or requires downloading a CV in a specific format, mobile session recordings will show immediate abandonment. On the client side, businesses looking to hire want to see case studies or sector specialisation. If your homepage does not clearly segment "Looking for a job" from "Looking to hire", your bounce rate will spike.
Fitness and Health
Local fitness businesses suffer heavily from generic traffic. They attract people searching for "cheap gym near me" who have zero intention of signing a 12 month contract. By analysing scroll depth, we see these users bounce after viewing the pricing table. The solution is not hiding the price, but rather restructuring the page to highlight the value, community, and specific results before revealing the membership cost. We shift the target audience from generic searchers to individuals looking for a structured programme.
Professional Services and Consulting
For B2B consulting firms, the buying cycle is long. Users will visit your site multiple times before making contact. Session recordings often show these users aggressively consuming content, printing case studies, and attempting to vet the credentials of the partners. The friction usually lies in a lack of accessible, high value content. If your site lacks a resource centre or clear evidence of past successes, serious buyers will look elsewhere. We use scroll maps to determine which sections of long form consulting proposals are actually being read.
The Strategic Imperative: Stop Guessing and Start Profiling
If you are frustrated by your website's performance, you need to stop guessing. Generic best practices will only get you so far. To achieve a blue ocean opportunity, you must intimately understand your specific audience and how they interact with your specific digital assets.
The advantage hiding in plain sight is literally on your screen right now. Your users are telling you exactly what they want through their clicks, their scrolls, and their abandoned sessions. Ignoring this data is like leaving money on the table.
Conversion rate optimisation is not a one time project. It is an ongoing discipline. Market conditions change. Competitor landscapes shift. User expectations evolve. Maintaining a 98 percent client retention rate requires us to continuously monitor, test, and refine the user journey.
If you are tired of empty clicks and want to start generating predictable, qualified leads, it is time to implement a rigorous heatmap and session recording methodology. Stop buying more traffic for a broken funnel. Let us find the advantage your competitors missed, fix the friction, and turn your website into the revenue generating asset it was meant to be. Book a discovery session with 3P Digital today. We will use our 3P Framework to turn your user behaviour insights into predictable revenue, without locking you into a restrictive contract.
Frequently Asked Questions
What is a heatmap and session recording methodology?
It is a structured approach to qualitative data analysis. Instead of looking at raw traffic numbers, you use visual tracking tools to see exactly how users interact with your website. Heatmaps show aggregate behaviour through colour coded overlays (clicks, scrolls, mouse movements), while session recordings let you watch individual user journeys. The methodology involves collecting this data, segmenting it, identifying points of friction, and testing data backed solutions to improve conversion rates.
How does this methodology directly increase revenue?
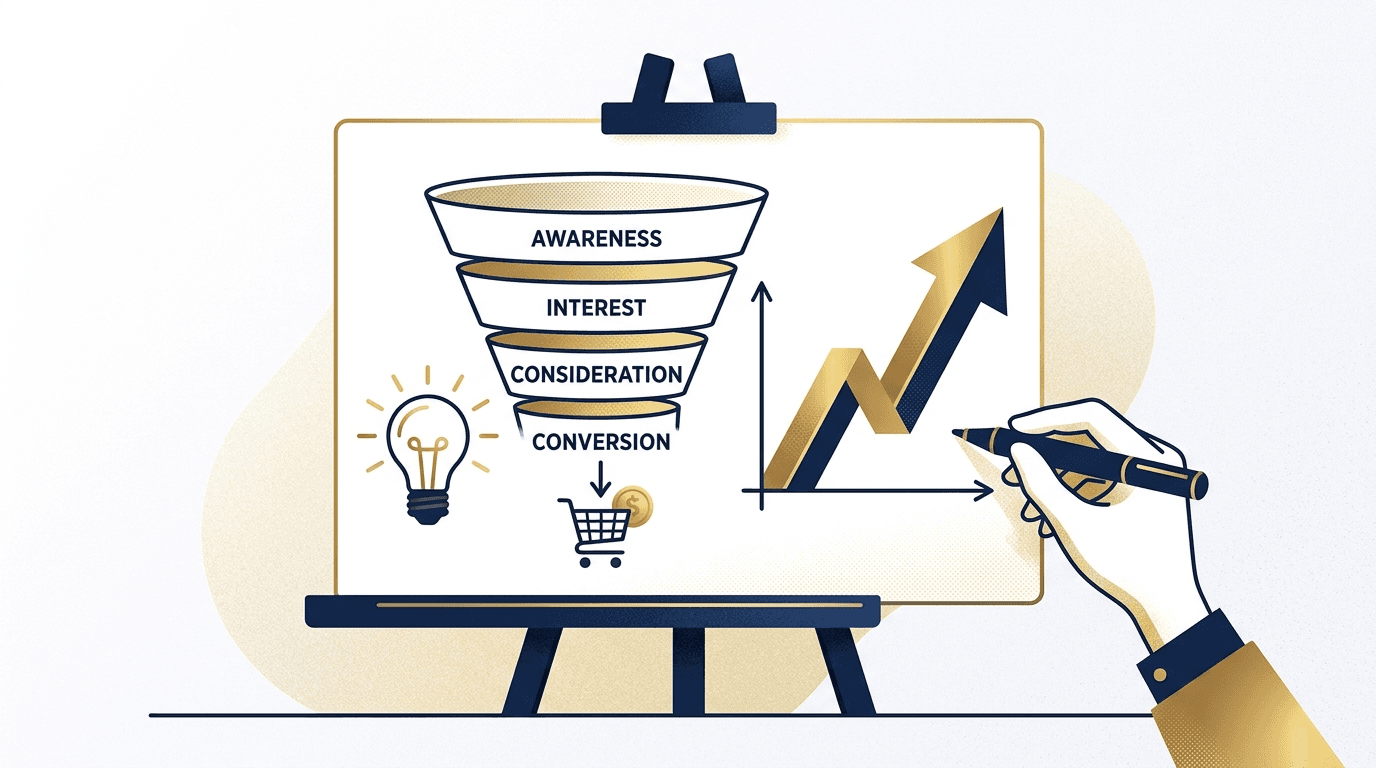
By identifying exactly where and why users abandon your website, you can fix the leaks in your sales funnel. If 100 people visit your contact page but only 2 fill out the form, analysing the behaviour of the 98 who leave will reveal friction points. Fixing those specific issues, such as simplifying a form or clarifying a call to action, directly increases the percentage of visitors who convert into leads, thereby lowering your cost per acquisition and increasing total revenue.
Is this analysis suitable for B2B companies?
Absolutely. In fact, it is often more critical for B2B and professional services firms because the value of a single qualified lead is much higher. A single B2B client might be worth tens of thousands of dollars in recurring revenue. Identifying why high intent buyers abandon a complex service page is incredibly lucrative. B2B sales journeys are longer, so removing micro-friction along that path has a massive cumulative impact on your bottom line.
Does heatmap tracking slow down my website?
Historically, adding heavy tracking scripts could impact load times. However, modern tools like Hotjar, Mouseflow, and Microsoft Clarity use asynchronous loading. When implemented correctly by a developer who understands performance optimisation, the impact on page speed is negligible. You can also configure the scripts to only load after the main content has fully rendered, ensuring the user experience is never compromised.
How do you ensure compliance with Australian privacy laws?
Compliance is strictly enforced. We configure all tracking tools to automatically suppress sensitive data. This means masking form fields that collect personal information like names, emails, phone numbers, and financial details. We also ensure that the cookie consent mechanism on the website explicitly covers analytics and tracking technologies, giving users the clear option to opt in or out in accordance with the Australian Privacy Principles.
How much traffic do I need for heatmaps to be useful?
You do not need massive traffic volumes to gain valuable insights. Even a few hundred sessions a month can reveal obvious usability issues, like broken links or confusing navigation. However, to achieve statistical significance when running A/B tests based on your findings, you will need a steady flow of consistent traffic. We generally recommend having at least 1,000 unique visitors per month to draw reliable, actionable conclusions from your heatmaps.
Why does 3P Digital not use lock in contracts?
We believe agencies should operate month to month without lock in contracts. True performance marketing means delivering measurable ROI through a live dashboard. If the strategy works and generates revenue, clients will stay because they see the value in the results. Lock in contracts are often used to protect agencies that fail to deliver consistent outcomes. We let our performance, which is always reported against revenue, justify the fee.
References
Australian Competition and Consumer Commission (ACCC): Scamwatch and Digital Privacy Guidelines.
Office of the Australian Information Commissioner (OAIC): Australian Privacy Principles guidelines.
Hotjar Documentation: How Heatmaps Work and Data Collection Methods.
Microsoft Clarity Documentation: Machine Learning Insights and Rage Click Tracking.