Performance Marketing KPIs and Benchmarks for Australian Businesses
Most Australian businesses are being sold vanity metrics disguised as marketing results. They receive monthly reports full of impressions, clicks, and engagement rates, but the actual bank balance remains unchanged. If your marketing agency cannot tie its activity directly to revenue, qualified leads, and a shorter sales cycle, you are paying for busywork.
The difference between good and bad marketing comes down to accountability. Bad marketing hides behind activity reports and complex jargon. Good marketing directs every dollar of spend towards qualified buyers. At 3P Digital, we do not believe in lock-in contracts. We believe every engagement must be reported against revenue on a live dashboard. If the numbers do not improve, the engagement has failed.
This guide breaks down the performance marketing KPIs and benchmarks that actually matter for Australian businesses in 2026. We will move past surface-level metrics and look at the data that drives real growth, including how we achieve a 98% client retention rate by focusing strictly on outcomes rather than retainers.
Key Takeaways
Vanity metrics like impressions and basic clicks do not pay the bills. You must track Customer Acquisition Cost (CAC), Return on Ad Spend (ROAS), and qualified Cost Per Lead (CPL).
Effective performance marketing requires sector-specific benchmarks. A good CPL in mortgage broking is vastly different from professional services.
Accountability must be structural. Agencies should operate month to month with no lock-in contracts. If an agency delivers results, clients will stay.
Deep discovery is non-negotiable. Generic messaging only attracts price shoppers. You need to find the advantage your competitors missed.
Real performance changes your sales cycle length, not just your website traffic.
Summary of Core Performance Marketing Metrics
Metric | What It Measures | Ideal Direction | Primary Use Case |
Customer Acquisition Cost (CAC) | Total sales and marketing spend to acquire one paying customer | Down | Evaluating overall business profitability |
Return on Ad Spend (ROAS) | Gross revenue generated for every dollar spent on advertising | Up | Scaling paid media budgets safely |
Cost Per Lead (CPL) | Media spend required to generate one inbound prospect | Down | Assessing top-of-funnel campaign efficiency |
Lead-to-Close Rate | Percentage of leads that convert into paying customers | Up | Measuring sales and marketing alignment |
Marketing Originated Customer % | Proportion of new customers driven by marketing efforts | Up | Proving marketing's value to the business |
The Problem with Vanity Metrics
The digital marketing industry has a transparency problem. For years, agencies have relied on impressive-looking spreadsheets that obscure a lack of commercial results. When a Melbourne recruitment firm comes to us complaining about their previous agency, the story is always the same. The agency reported a 200% increase in organic traffic, but the firm's placement revenue remained flat.
Why does this happen? Because traffic is not a commercial KPI. It is a vanity metric.
A vanity metric is any data point that looks good on paper but does not correlate directly with revenue. Examples include raw impressions, page views, social media followers, and time on page. These numbers are easy to grow because they are easy to manipulate. An agency can buy 10,000 bot clicks for a few dollars and show you a beautiful upward trend line. They cannot, however, fake a 46:1 return on SEO investment.
Defining the Dividing Line
The dividing line between good and bad marketing is the direct connection to revenue. Good marketing is pointed at buyers, not vanity traffic. If you own a Sydney tech recruitment agency, you do not need 50,000 students looking for entry level jobs to read your blog. You need 10 qualified Chief Technology Officers to book a consultation.
Consider a recent engagement we took over. MEC Builders was spending $8,000 a month on Google Ads with a $247 cost per lead and a 1.2% conversion rate. Three previous agencies had failed to move these numbers. The previous agencies sent reports showing thousands of clicks and high impression shares. They celebrated the click-through rate. But a 1.2% conversion rate meant the vast majority of that expensive traffic was completely useless. It was the definition of vanity traffic.
To fix this, we had to abandon the vanity metrics entirely. We stopped looking at impression share and started looking at intent. We rebuilt the entire funnel around first-time renovators, a highly specific and profitable audience. We moved the focus from clicks to closed deals.
The Core KPIs You Must Track
To run a accountable, performance-focused marketing operation, you must strip your reporting down to the metrics that affect your profit and loss statement. These are the core KPIs we track across every 3P Digital engagement.
Customer Acquisition Cost (CAC)
Your Customer Acquisition Cost is the total amount of money you spend on sales and marketing divided by the number of new customers acquired over that same period. If you spend $20,000 in a month and acquire 10 new clients, your CAC is $2,000.
CAC is the ultimate measure of marketing efficiency. It forces marketing teams to care about quality, not just volume. If you lower your cost per lead by generating low-intent clicks, your sales team will waste hours talking to unqualified prospects, and your effective CAC will skyrocket because you will close fewer deals.
Return on Ad Spend (ROAS)
While CAC looks at total acquisition cost, ROAS looks specifically at the advertising engine. It measures how much gross revenue you generate for every dollar spent on ads. If you spend $1,000 on Google Ads and generate $5,000 in revenue, your ROAS is 5:1.
Understanding your break-even ROAS is critical. For an e-commerce store with tight margins, you might need a 3:1 ROAS just to cover the cost of goods sold and overhead. For a high-ticket professional services firm with 80% gross margins, a 2:1 ROAS might be highly profitable.
Cost Per Lead (CPL) and Lead Quality
Cost Per Lead is the media spend divided by the number of leads generated. However, CPL is a dangerous metric if tracked in isolation. A $20 lead from a low-intent display campaign is often more expensive in the long run than a $150 lead from a high-intent branded search campaign.
Effective CPL tracking requires segmenting your leads by quality. When we took over the MEC Builders account, the initial CPL was $247. By shifting the targeting away from generic building terms and focusing strictly on first-time renovators, we achieved a 63% lower cost per lead. We drove the CPL down to $91. More importantly, because the leads were higher quality, the conversion rate jumped from 1.2% to 4.7%.
Sales Cycle Length
Marketing directly impacts how long it takes a prospect to become a paying customer. If your messaging is confusing or generic, prospects will stall. They will need multiple meetings, extensive follow-up, and heavy discounts to convert.
When your messaging is sharp and your offers are highly relevant, the sales cycle shrinks. For MEC Builders, rebuilding the ads and adding CRM automation to nurture high-intent leads shrank the sales cycle by 55%, dropping from 47 days to just 21 days. A shorter sales cycle means better cash flow and a higher capacity for growth without adding more sales staff.
Australian Industry Benchmarks for 2026
Generic benchmarks are useless without context. A good CPL in one industry is a disaster in another. Below are the realistic performance marketing benchmarks we observe across key Australian sectors in 2026. These figures represent highly optimised campaigns managed by accountable agencies, not entry-level attempts.
Mortgage Broking Benchmarks
The Australian mortgage broking industry is highly competitive. With the major banks spending millions on brand advertising, independent brokers must be surgical with their media spend.
Target CPL: $80 to $140 per qualified lead. A qualified lead is a borrower who has completed a full fact find or explicitly requested a consultation.
Lead-to-Close Rate: 8% to 12%. Closing rates depend heavily on the broker's ability to service the loan and the lender panel.
Organic Search Traffic: This is the highest yielding channel. We recently achieved a 312% increase in organic traffic for a Queensland mortgage broking client over a 6-month period. The traffic was entirely focused on local suburb keywords and specific loan types.
Tech and Professional Recruitment Benchmarks
Recruitment is a dual-sided marketplace. You need candidates and clients. Performance marketing for recruitment must focus on client acquisition, as candidate acquisition is usually handled through inbound job boards.
Target CPL (Client Acquisition): $250 to $400 per qualified hiring manager.
Average Placement Value: $18,000 to $35,000. Because the lifetime value is so high, recruitment firms can afford a higher CPL.
Sales Cycle: 60 to 120 days.
Strategic Positioning Benchmark: This is where most agencies fail. We worked with a Sydney tech recruitment agency competing against 200-plus generic recruiters on price. They faced six-month sales cycles and $15K average placement fees. By identifying a blue ocean opportunity and repositioning the firm entirely around tech scale-ups, we reduced the sales cycle to 2 months and increased average placement fees by 87% to $28K.
Professional Services and B2B Benchmarks
Accounting firms, law firms, and B2B consultancies face long trust cycles. Buyers do not hire a lawyer or a fractional CIO based on a single Facebook ad.
Target CPL: $150 to $300 per consultation request.
Lead-to-Close Rate: 10% to 15%.
Primary KPI: Cost per Acquisition. Because the lifetime value of a B2B client often exceeds $50,000, tracking CPL is less relevant than ensuring the total CAC remains below $3,000.
Content Engagement: Quality over quantity. Professional services firms must track content downloads, webinar attendance, and consultation requests, not social media likes.
Automotive and E-commerce Benchmarks
Selling physical products or automotive parts requires a relentless focus on margin and return on ad spend.
Target ROAS: 4:1 to 8:1. Anything below 4:1 is usually unprofitable once shipping, warehousing, and cost of goods sold are factored in.
Conversion Rate: 1.5% to 3% for paid traffic.
Organic Traffic ROI: SEO is the anchor channel for e-commerce. For an automotive parts supplier, we generated a 46:1 return on SEO investment over a 12-month period. This was achieved by targeting highly specific part numbers rather than broad category terms.
The 3P Digital Difference: Profile, Plan, Perform
You cannot achieve these benchmarks by blindly launching ad campaigns. Performance marketing requires a systematic approach that aligns your positioning, your strategy, and your execution. This is why we operate on our proprietary 3P Framework: Profile, Plan, Perform.
Phase 1: Profile
Every engagement starts with deep discovery. Marketing fails when it operates as a set of disconnected tactics. Before we spend a single dollar on ads, we must find the advantage hiding in plain sight within your business.
We interview your most profitable clients. We analyse your competitors. We build your Ideal Customer Profile (ICP). We look for the positioning gap that allows you to charge a premium. Generic messaging only attracts price shoppers. If you sound exactly like your competitors, the only way you can compete is on price. That is a race to the bottom.
For the Sydney tech recruitment agency mentioned earlier, the Profile phase revealed that while 200 other recruiters were fighting over generic IT roles, there was a massive, underserved market in tech scale-ups needing specific engineering talent. That insight formed the foundation of their entire growth strategy.
Phase 2: Plan
Once we understand your unique advantage, we build the go-to-market strategy. The Plan phase is where we establish the KPIs and benchmarks. We set the target CPL, the acceptable CAC, and the projected ROAS.
We do not deliver cookie-cutter packages. Positioning, messaging, and offers must be built strictly around the unique advantages uncovered during the Profile phase. If you are a mortgage broker targeting first home buyers in specific Queensland suburbs, your plan will look completely different from a commercial broker in the Sydney CBD.
The Plan phase also involves structural setup. We build the CRM workflows, the live dashboards, and the tracking infrastructure. We ensure that every lead, every call, and every sale is attributed back to the exact marketing channel that generated it.
Phase 3: Perform
This is where tactics meet accountability. In the Perform phase, we execute the strategy. We run the paid media, deploy the SEO programme, and launch the outreach campaigns.
But execution without measurement is useless. Everything we do in the Perform phase is reported against revenue on a live dashboard. You see exactly what we see. You know what we are spending, what we are generating, and how the campaigns are performing in real-time.
This is how we maintain a 98% client retention rate across our entire client base. When clients can log in and see a 46:1 return on SEO investment, or a 63% reduction in their cost per lead, they do not need to be locked into contracts. The results justify the spend.
The No Lock-In Advantage
Most digital marketing agencies in Australia will try to lock you into a 6 or 12-month contract. They will tell you that SEO takes time, and they need security to recoup their setup costs.
This is partially true. SEO and deep brand positioning do take time. An effective performance marketing strategy does not yield a 312% increase in organic traffic overnight. However, the desire for long-term contracts often masks a lack of confidence in their own execution.
Why Agencies Use Lock-In Contracts
Lock-in clauses breed complacency. When an agency knows they have you trapped for 12 months, the urgency to deliver results drops. The first month is spent on strategy, the second month on implementation, and by the third month, they are sending you reports full of vanity metrics explaining why the actual revenue is still lagging.
Agencies should operate month to month with no lock-in contracts. If an agency is genuinely focused on accountable execution and generating a measurable return on investment, the results will retain the client. The fear of losing a client every month is the ultimate driver of performance.
The Month-to-Month Reality
At 3P Digital, we work month to month. Our clients stay because the numbers work. When we shifted a national recruitment firm away from expensive job boards and towards an SEO-led strategy, we achieved a 63.5% reduction in cost per lead. That client did not need a contractual obligation to keep paying us. They saw the cost savings and the revenue growth on their live dashboard.
Operating without lock-in contracts forces a performance mindset. We cannot hide behind legal agreements. Every 30 days, we have to prove our value. If we fail to hit the benchmarks established in the Plan phase, we deserve to lose the client.
Pay for Performance Marketing in Australia
The shift towards pay for performance marketing in Australia is accelerating because business owners are tired of paying retainers for unaccountable busywork. They want to know exactly what they are getting for their money.
Performance marketing means we share the risk. We do the deep discovery work. We build the strategy. We execute the campaigns. And we tie our fees to the metrics that matter. If your cost per lead does not drop, or your organic traffic does not grow, you have the freedom to walk away.
This model aligns our incentives with yours. We do not make money by keeping you in a retainer. We make money by driving measurable growth.
Deep Dive: Rebuilding an Unprofitable Campaign
To understand how performance marketing KPIs work in practice, let us look under the hood of a real intervention. This is the exact process we used to turn around the MEC Builders account.
Step 1: Auditing the Existing Metrics
The previous agency had MEC Builders spending $8,000 a month on Google Ads. Their primary KPI was clicks and cost per click. They were driving traffic to a generic homepage. The result was a $247 cost per lead and a 1.2% conversion rate.
We immediately killed 80% of the existing ad spend. We paused the campaigns targeting generic terms like "builder Sydney" and "home renovations". These terms attract people looking for ideas, or price shoppers comparing 10 different quotes.
Step 2: Conducting Deep Discovery
We interviewed 20 of MEC Builders' most profitable past clients. We wanted to know why they chose MEC, what their fears were, and what specific problems MEC solved better than anyone else.
The discovery process revealed that MEC was exceptionally good at managing the psychological stress of first-time renovators. They had a system for keeping clients informed, minimising budget blowouts, and delivering on time. This was the advantage hiding in plain sight. The previous agency had completely ignored this positioning.
Step 3: Rebuilding the Funnel
We rebuilt the entire ad campaign around first-time renovators. We created specific landing pages addressing their exact fears: budget overruns, unreliable tradespeople, and living on a dusty building site.
We added CRM automation to nurture these leads. When a prospect downloaded a guide on "Surviving Your First Renovation", the CRM automatically tagged them and sent a sequence of educational emails building trust in the MEC brand.
Step 4: Tracking the Right KPIs
We threw out the cost-per-click reports. We set up a live dashboard tracking Cost Per Lead, Lead Quality Score, and Lead-to-Close Rate.
The results were immediate and substantial. Over the next 90 days, the campaign achieved a 63% lower cost per lead, dropping from $247 to $91. The conversion rate jumped 292%, from 1.2% to 4.7%. Because the leads were highly qualified and pre-educated by the CRM automation, the sales cycle shrank by 55%, dropping from 47 days to 21 days.
This is what happens when you align marketing tactics with actual business strategy and hold the execution accountable to revenue-based KPIs.
Establishing Your Own Benchmarks
If you are a business owner or a marketing manager in Australia, you need to establish clear benchmarks for your own organisation. You cannot rely on industry averages alone. You need to understand the specific maths of your business.
Step 1: Calculate Your Maximum Allowable CAC
How much can you afford to spend to acquire a new customer? Look at your gross margin, your lifetime value, and your operating expenses. If your average client brings in $10,000 in gross profit over their lifetime, and you want a 3:1 return on your acquisition spend, your maximum CAC is $3,333.
Every marketing decision must be filtered through this number. If an agency proposes a campaign that costs $4,000 to acquire a client, you know it will lose you money.
Step 2: Map Your Sales Cycle
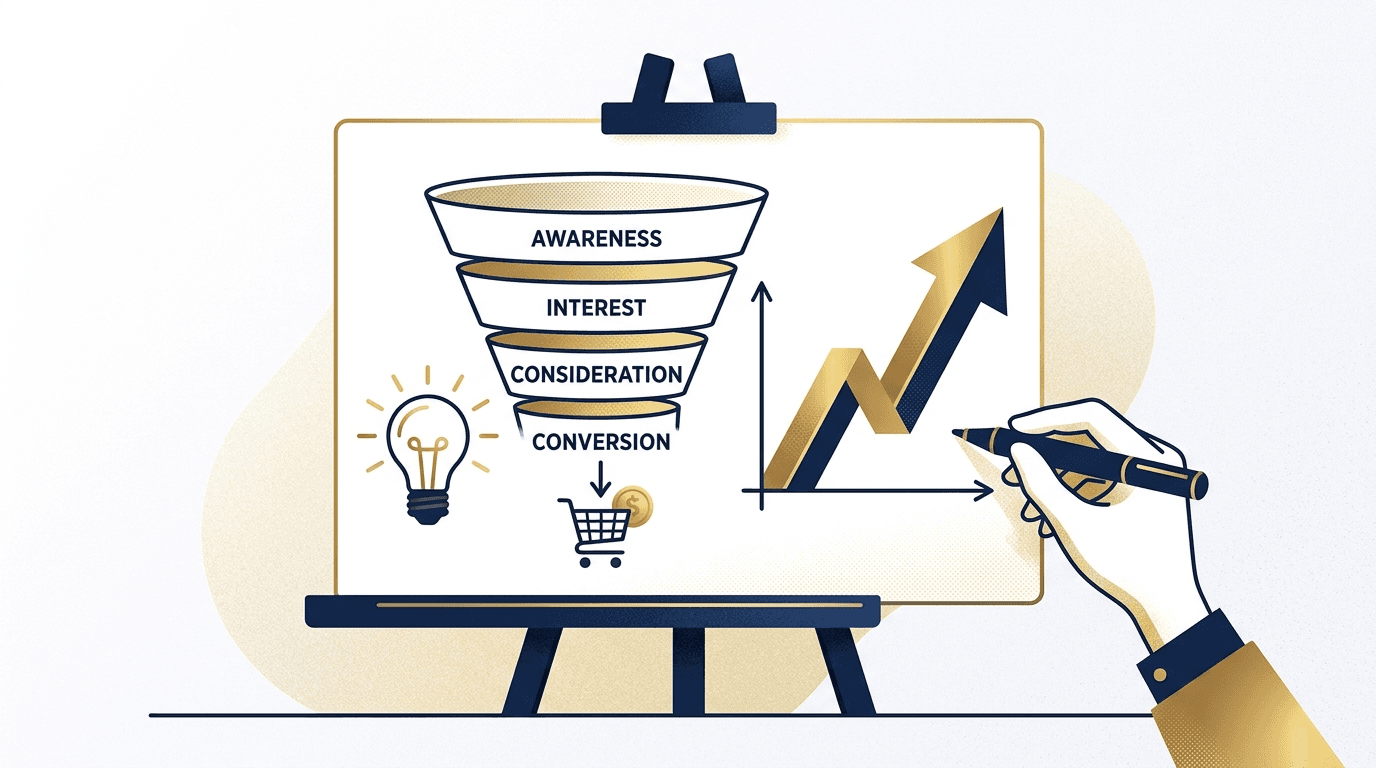
Map out the exact steps a prospect takes from initial awareness to closed deal. How many touchpoints are required? How long does it take on average? This helps you set realistic expectations for your marketing campaigns.
If your sales cycle is 6 months, do not expect a Google Ads campaign to generate a positive ROAS in the first 30 days. You will be paying for leads that take half a year to convert. Your reporting needs to account for this lag.
Step 3: Build a Single Source of Truth
Data fragmentation kills performance marketing. If your ad platform shows 50 leads, your CRM shows 30 leads, and your sales team reports 10 closed deals, you have a tracking problem. You need a single source of truth.
We use advanced analytics platforms to tie every closed deal back to the exact keyword, ad, or organic search query that initiated the contact. This is the only way to know which 50% of your marketing budget is actually working.
Tracking Competitor SERP Visibility
In 2026, monitoring your competitors' Search Engine Results Page (SERP) visibility is a critical performance metric. If your competitors are ranking for high-intent commercial keywords and you are not, they are capturing the market share that should belong to you.
SERP tracking involves monitoring which domains appear for your target keywords, what types of content they are ranking with, and how their visibility trends over time. This is not about vanity. It is about understanding the competitive landscape.
For the automotive parts supplier we worked with, tracking SERP visibility allowed us to identify hundreds of specific part numbers that competitors were ignoring. By building highly targeted catalogue pages for these parts, we achieved a 46:1 return on SEO investment. We found the advantage your competitors missed by looking exactly at what they were failing to optimise for.
The Role of Website Benchmarks in Performance
While traffic is a vanity metric, website behaviour metrics are performance indicators. If you are driving highly qualified traffic to your site but they are not converting, your website is the bottleneck.
Engagement Rate
Engagement rate measures the percentage of users who interact with your site beyond the initial click. A healthy engagement rate for a B2B service site is between 50% and 60%. If your engagement rate is below 40%, your landing page does not match the intent of the ad or the search query.
Average Session Duration
For professional services or high-ticket B2B, an average session duration of 2 to 3 minutes indicates strong interest. If users are bouncing in under 30 seconds, you are either attracting the wrong audience or providing a terrible user experience.
Conversion Rate Optimisation
Conversion Rate Optimisation (CRO) is the process of continually testing and improving your website to increase the percentage of visitors who take a desired action. A 1% improvement in your website conversion rate can double the effectiveness of your entire marketing budget without spending an extra dollar on ads.
Marketing ROI Benchmarks: Moving Beyond the Click
Calculating true Marketing ROI is complex but necessary. The basic formula is (Gross Revenue from Marketing minus Marketing Investment) divided by Marketing Investment.
However, this simple calculation often misleads business owners because it fails to account for the sales cycle. If you spend $50,000 on SEO in January, the revenue from that investment might not close until September.
Multi-Touch Attribution
To get an accurate ROI benchmark, you need multi-touch attribution. This means tracking every interaction a buyer has with your brand before they purchase. Did they click a Google Ad in February, read a blog post in April, and finally book a consultation from an organic search result in June?
If you only give credit to the final click, you will undervalue the top-of-funnel ads that initiated the relationship. Multi-touch attribution distributes the credit across all touchpoints, giving you a realistic picture of what is actually driving revenue.
The Impact of CRM Automation on ROI
CRM automation is a massive multiplier for marketing ROI. When we implemented CRM automation for MEC Builders, we did not just improve their ad performance. We improved their sales efficiency.
Automated lead scoring and nurturing meant the sales team only spent time talking to highly qualified prospects. This reduced the wasted hours spent chasing dead leads, effectively lowering the labour cost associated with each acquisition. True performance marketing looks at the entire cost of acquisition, including staff time, not just the media spend.
Identifying the Advantage Hiding in Plain Sight
Let us return to the Sydney tech recruitment agency. They were stuck. Six-month sales cycles. $15K placement fees. Competing on price against massive generic agencies.
When we conducted the Profile phase, we did not look at their ad campaigns. We looked at their business. We interviewed their clients. We mapped the market.
We found that tech scale-ups were desperate for specific engineering talent that the generic agencies could not source. The advantage hiding in plain sight was that this specific recruitment firm actually understood how to evaluate technical talent, whereas the big agencies just matched keywords on a CV.
By repositioning the firm entirely around this specific strength, we changed the entire trajectory of the business. We rebuilt the website to speak directly to scale-up founders. We launched targeted LinkedIn outreach campaigns.
The result was an 87% increase in average placement fees to $28K, a reduction in the sales cycle to 2 months, and the generation of $2M in new revenue. We captured an estimated 10-15% market share in a highly lucrative niche.
This is what happens when you refuse to deliver cookie-cutter packages. Positioning, messaging, and offers must be built strictly around the unique advantages uncovered during the discovery phase.
Conclusion: Demand Accountability
The era of paying retainers for unaccountable busywork is over. In 2026, Australian businesses have access to the data and the tools to demand complete transparency. Performance marketing is not a buzzword. It is a structural commitment to tying every dollar of spend directly to revenue.
If your current agency reports on impressions instead of customer acquisition costs, you are losing money. If they require a 12-month lock-in contract, they do not trust their own ability to retain you.
At 3P Digital, we operate differently. We start with deep discovery to find the competitive advantage hiding in plain sight in your business. We build targeted strategies using our Profile, Plan, Perform framework. We execute relentlessly, and we report every metric against actual revenue on a live dashboard.
Are you ready to stop paying for vanity traffic and start paying for performance? Book a discovery session with us today. We will find the advantage your competitors missed and turn it into measurable, revenue-driving growth.
Frequently Asked Questions
What is performance marketing?
Performance marketing is an approach to digital marketing where agencies or internal teams are held strictly accountable for the commercial results of their campaigns. Instead of paying for activity or potential reach, you pay for measurable outcomes like qualified leads, reduced cost per acquisition, and revenue growth.
How do you track marketing ROI?
We track marketing ROI using multi-touch attribution models integrated directly into your CRM. This allows us to tie every closed deal back to the specific marketing channel, campaign, or keyword that initiated the contact, providing an accurate picture of gross revenue generated versus total marketing investment.
What is a good Cost Per Lead (CPL) in Australia?
A good CPL depends entirely on your industry and the lifetime value of your customer. For a Queensland mortgage broker, a CPL between $80 and $140 is excellent. For a B2B recruitment firm, a CPL of $250 to $400 is acceptable because the average placement fee is so high. You must calculate your own maximum allowable CAC first.
Why does 3P Digital not use lock-in contracts?
We do not use lock-in contracts because we believe accountability should be structural, not optional. If an agency is genuinely focused on generating a measurable return on investment, the results will retain the client. Operating month to month forces a performance mindset and prevents complacency.
How long does it take to see results from SEO?
SEO is a long-term programme. While some technical fixes can yield quick wins, a comprehensive strategy aimed at high commercial intent keywords typically takes 3 to 6 months to show significant traction. For one automotive parts supplier, consistent execution over a 12-month period resulted in a 46:1 return on SEO investment.
What KPIs should a recruitment agency track?
A tech or professional recruitment agency should track Client Acquisition Cost, Lead-to-Close Rate, Average Placement Fee, and Sales Cycle Length. Tracking candidate metrics is useful for operational purposes, but marketing should be exclusively focused on client acquisition and revenue generation.
References
Australian Bureau of Statistics (ABS). Digital Activity and Technology Use by Australian Businesses.
Australian Competition and Consumer Commission (ACCC). Digital Platform Services Inquiry Reports.
Google Analytics. Official documentation on Multi-Channel Funnels and Attribution Modelling.